Life expectancy varies by as much as 9.5 years across Metro Vancouver
Life expectancy in Metro Vancouver can vary by as much as 9.5 years depending on the neighbourhood in which you live, a new UBC-led study has found.

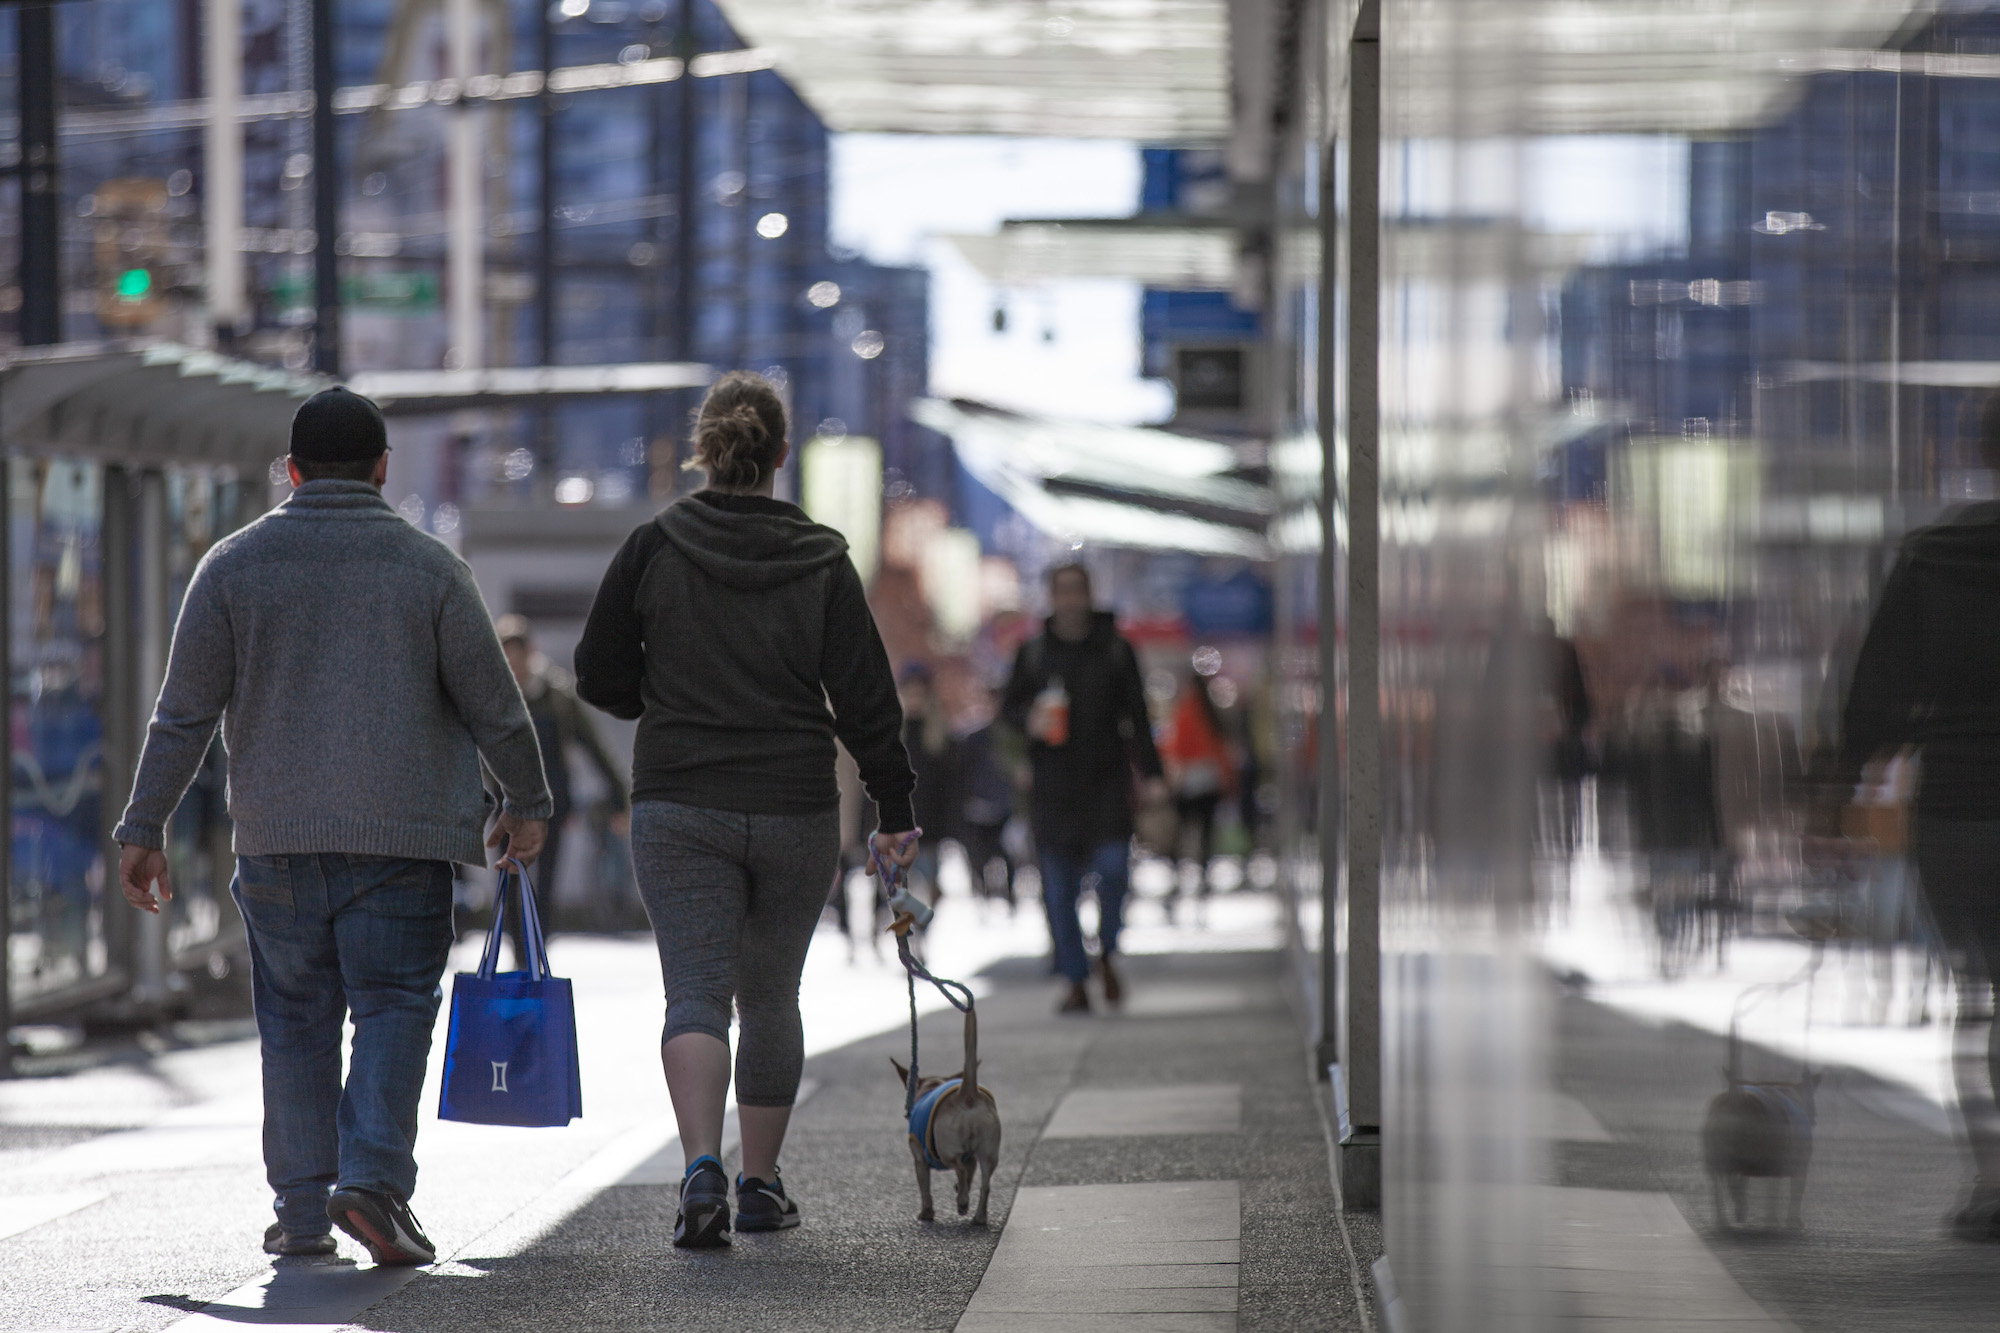
Credit: GoToVan | Creative Commons
Life expectancy in Metro Vancouver can vary by as much as 9.5 years depending on the neighbourhood in which you live, a new UBC-led study has found.
Vancouver remains one of the healthiest cities in the world, but inequality in life expectancy between its neighbourhoods has grown considerably since 2001.
“In these data we can see the actual inequality that occurs within the city and where it occurs,” said Jessica Yu, a doctoral candidate at UBC’s school of population and public health who was lead author of the study published this week in Health and Place. “We are seeing high inequality within a city that has a relatively high life expectancy overall.”
The study is the first in Canada to analyze life expectancy and causes of death at the census tract level over a period of more than a quarter-century. Using de-identified data from the Population Data BC research resource, Yu and her team harmonized information on age, sex, cause of death, residence and location of death with Statistics Canada population data from census years 1991, 1996, 2001, 2006, 2011 and 2016.
The result is an interactive data map that can be manipulated to show life expectancy and mortality rate by various causes of death at the census tract level over 27 years.
It came as little surprise to the researchers that life expectancy is lowest in pockets of the region where poverty has taken hold. However, the data reveals stark contrasts between census tracts within close proximity of each other. For example, residents living just five kilometres apart in the City of Vancouver may be more than 10 years apart in life expectancy.
Overall life expectancy in Metro Vancouver increased during the study period. At the 2016 census it was 86.6 years for women and 82.5 years for men. However, certain areas such as the Downtown Eastside and Haney in Maple Ridge had a life expectancy of less than 75 years for both women and men.
Statistically, residents of those areas have life expectancies that are comparable to the average life expectancies in Indonesia (71.8 years) and Russia (73.2 years).
Life expectancy was highest in West Vancouver, West Point Grey, northwest Richmond and parts of South Surrey and Coquitlam.
The causes of death that drive some of these disparities are evident in the data. Death rates from cancers, HIV/AIDS and sexually transmitted diseases varied widely between census tracts. For these causes, some neighbourhoods had a mortality rate 17 times higher than others in the city. Prostate cancer among men yielded particularly stark contrasts.
To measure how inequality has changed over time, the researchers compared the gap in life expectancy between the 10 per cent of census tracts with highest and lowest life expectancy.
Interestingly, the gap shrank between 1990 and 2001 but then reversed direction and grew for the final 16 years of the study period.
The study doesn’t reveal why these inequalities have grown since 2001, but Yu noted that some census tracts have more services, more green space and more transit access than others.
“Can these sorts of things explain some of these disparities? Now that we have this important dataset, I’m hoping future studies will make these linkages and help explain why we are seeing some of the inequalities,” Yu said. “That research could help urban planners and health planners direct resources accordingly.”
The study reveals more about death and its causes at the neighbourhood level in Metro Vancouver than any before. However, attributing those outcomes to specific policies or social factors is work that’s still to come.
All inferences, opinions, and conclusions drawn in this study are those of the authors, and do not reflect the opinions or policies of the Data Steward(s).


